The goal of all lottery strategies is the prediction of winning numbers that will hit in the next draw. Lottery players in most cases search for the most frequent or the least frequent numbers, then examine the latest winning numbers and/or their statistical properties trying to guess what is the most likely to happen in the next draw.
Expert Lotto has built-in tool which automates the prediction process to some extent. The application will search through selected past draws and compare them with the latest winning numbers to predict the numbers and statistical properties that are expected in the coming draw. As all other Expert Lotto features, the predictions are based on solid math. With the same input data and the same settings the predictor will always provide the same, reproducible results. There is no magical black-box spitting out different numbers each time it is clicked. Expert Lotto predictor is based on pattern matching algorithm which is widely used in many other computer-assisted fields – facial recognition, statistical data analysis, signal processing etc.
The following table lists 15 latest draws in Expert Lotto 6/49 lottery in descending order:
| Date | Position 1 | Position 2 | Position 3 | Position 4 | Position 5 | Position 6 | Bonus |
| 2010/28 Sun 2nd | 23 | 29 | 36 | 42 | 44 | 47 | 7 |
| 2010/28 Sun 1st | 6 | 13 | 14 | 19 | 41 | 42 | 29 |
| 2010/28 Wed 2nd | 2 | 13 | 16 | 17 | 25 | 40 | 27 |
| 2010/28 Wed 1st | 16 | 18 | 22 | 23 | 28 | 29 | 24 |
| 2010/27 Sun 2nd | 1 | 6 | 12 | 24 | 32 | 41 | 44 |
| 2010/27 Sun 1st | 2 | 15 | 22 | 29 | 30 | 37 | 42 |
| 2010/27 Wed 2nd | 20 | 23 | 25 | 30 | 33 | 35 | 7 |
| 2010/27 Wed 1st | 8 | 11 | 19 | 26 | 48 | 49 | 18 |
| 2010/26 Sun 2nd | 8 | 11 | 18 | 32 | 36 | 38 | 6 |
| 2010/26 Sun 1st | 5 | 6 | 11 | 31 | 40 | 43 | 32 |
| 2010/26 Wed 2nd | 4 | 18 | 26 | 33 | 35 | 47 | 11 |
| 2010/26 Wed 1st | 5 | 12 | 25 | 31 | 44 | 46 | 33 |
| 2010/25 Sun 2nd | 10 | 15 | 28 | 30 | 36 | 43 | 35 |
| 2010/25 Sun 1st | 16 | 21 | 24 | 25 | 35 | 46 | 47 |
| 2010/25 Wed 2nd | 9 | 12 | 23 | 34 | 39 | 49 | 24 |
The latest three numbers at the second ticket position are: 13, 13 and 29. Those three numbers form the latest pattern. The pattern size is 3 as it consists of three numbers.
Now we will search the past winning numbers at the second ticket position and look for a similar pattern. The table above shows that the best matching past pattern can be found in draws 2010/26 Sun 2nd to 2010/27 Wed 2nd. The past winning numbers are 11, 11 and 23. The following draw is 2010/27 Sun 1st where the second winning number is 15. So the prediction for the coming draw 2010/29 Wed 1st is number 15 at the second ticket position.
Let's verify our prediction in Expert Lotto:
Winning Number Properties window opens and its table will show the following value in Position 2 column:
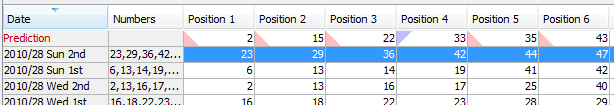
The downward red triangle indicates that the predicted trend is decrease in the next draw and the number predicted for the second ticket position is 15. See below for more instructions how to interpret the prediction results.
If we let the predictor scan the whole database of past winning numbers then it will find the best matching pattern in draws 2006/23 Sun 2nd to 2006/24 Wed 2nd. Their winning numbers are 12, 16 and 30. The following winning number at the second ticket position is 11. That means the predicted trend is again decrease and the predicted value is 11.
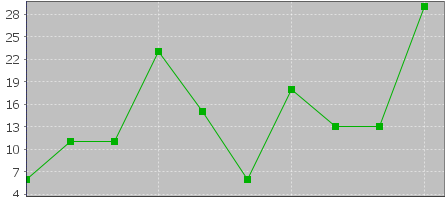
What happens if we increase the pattern size from three numbers to 10 numbers? The latest pattern is then 6,11,11,23,15,6,18,13,13,29. When displayed in a chart the numbers look like this:
The predictor will find best matching pattern in draws 2008/45 Sun 2nd to 2008/48 Wed 1st where the winning numbers are 9,20,13,21,12,8,15,15,4,27. The numbers in a chart look like this:
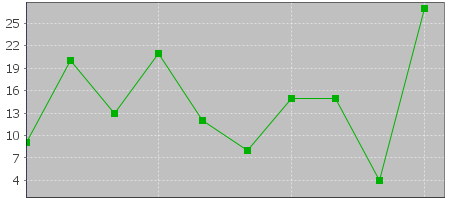
The following number at the second ticket position is again 11 (draw 2008/48 Wed 2nd). That means the predicted trend is again decrease and the predicted value is 11.
If you compare the chart of the latest pattern and the chart of the found matching pattern above, you can see that the match is actually very loose. But it is still the best match the predictor can find in the whole database of past winning numbers. We cannot realistically expect to find a sequence of past winning numbers that is exactly the same as the ten latest draws. The longer the patterns are the less similarities between the latest pattern and the best matching pattern. So how to select the optimal pattern size?
In the examples above we used pattern size 3 which gave us predicted value 11 and pattern size 10 also with predicted value 11. In this case we have the same results. But what if the predicted values or even the predicted trends were different? How to tell which prediction is more credible?
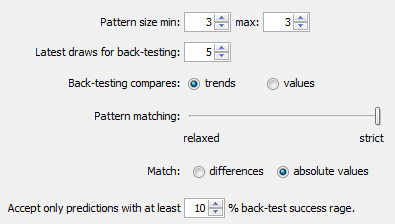
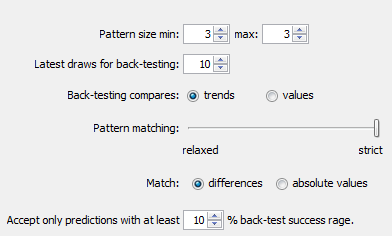
The predictor runs a series of tests and selects the best pattern size automatically. Option Latest draws for back-testing in prediction settings screen defines how deep this back-testing is. If the prediction settings are for example Pattern size min 3, max 15, Latest draws for back-testing: 10 then the predictor will make 130 predictions to pick the optimal pattern size. It will start with pattern size 3, make prediction for draw 2010/28 Sun 1st and compare the predicted trend with actual value from the following draw 2010/28 Sun 2nd. Then it will make prediction for draw 2010/28 Wed 2nd and compare the predicted trend with the value from the following draw 2010/28 Sun 1st. There will be 10 such testing predictions up to draw 2010/26 Wed 2nd. The predictor will count how many predicted trends were correct when compared with the following draws.
Then the pattern size will increase to four and the predictor will make another ten testing predictions for ten latest draws. The count of correct trend predictions is noted. The pattern size is increased to five and the testing runs are repeated. This continues up to pattern size 15 as selected in prediction settings. Then the predictor will select the pattern size that had the highest count of correct trend predictions. This optimal pattern size is then used to make the actual prediction for the latest draw 2010/28 Sun 2nd. In this case the best pattern size is 3 because seven trend predictions were correct during back-testing. When using pattern size 10, there were only 4 valid trend predictions out of the ten back-test runs.
![]() Hover mouse cursor above table cell with prediction result to see a tooltip with the best pattern size and the count of back-test predictions that were correct.
Hover mouse cursor above table cell with prediction result to see a tooltip with the best pattern size and the count of back-test predictions that were correct.
With option Back-testing compares values you can modify the prediction algorithm to select the pattern size that predicts values which are closest to the actual values when back-testing.
![]() Some lottery operators publish additional details about each draw – which set of balls has been used, which drawing machine etc. If the balls and/or machines are being changed at regular intervals it probably makes sense to use pattern sizes shorter than the interval between such changes.
Some lottery operators publish additional details about each draw – which set of balls has been used, which drawing machine etc. If the balls and/or machines are being changed at regular intervals it probably makes sense to use pattern sizes shorter than the interval between such changes.
The predictor has two modes of pattern matching. It can match either absolute values in a sequence of numbers as demonstrated above or it can match number differences instead. Let's have the following sequence of numbers:
31,35,13,20,15,5,2,10,4,25,3,10,5
Let's consider the last three numbers as the latest pattern: 3,10,5. When matching absolute values then the best matching pattern is 2,10,4 followed by number 45. However when matching number differences then the best matching pattern is 13,20,15 followed by number 5.
The same sequence of numbers expressed as value differences looks like this:
+31,+4,-22,+7,-5,-10,-3,+8,-6,+21,-22,+7,-5
So the latest pattern has changed to -22,+7,-5 and the best matching pattern is -22,+7,-5 corresponding to numbers 13,20,15 followed by number 5. So when matching differences the matching pattern must have the same shape (the order of increasing/decreasing values) as the latest pattern however all its values may be shifted up or down when compared with the latest pattern.
Now we will repeat the prediction for the second ticket number and use differences pattern matching instead of absolute values:
The best matching pattern are draws 2006/20 Wed 1st to 2006/20 Sun 1st with numbers 4,4,21, which translate to differences -3,0,+17. The following difference is -8.
The differences of the latest pattern are -5,0,+16. The predicted value is
29 – abs( -8 * (abs(-5/-3) + abs(0/0) + abs(16/17)) / 3 * ) = 29 – 9.62 = 19.
Note that the predicted value includes correction which takes into account the differences between the latest and best matching patterns.
The same prediction with pattern size 10 will find the best matching pattern at draws 2009/24 Wed 1st to 2009/26 Wed 2nd where the numbers are 5,15,15,20,13,10,14,9,6,11 and the following number is 21. The prediction is increase to 46. This prediction is conflicting with the prediction with pattern size 3. However this prediction is a bit less credible as the back-testing passed in 5 out of 10 back test runs, while pattern size 3 predictions had 6 valid trend predictions during back-testing.
![]() It is recommended to use differences pattern matching especially for predictions of derived values like History sums and differences. Absolute values pattern matching is suitable for values with a small range, for example sum root, odd/even or the actual winning numbers at individual ticket positions.
It is recommended to use differences pattern matching especially for predictions of derived values like History sums and differences. Absolute values pattern matching is suitable for values with a small range, for example sum root, odd/even or the actual winning numbers at individual ticket positions.
Pattern matching slider in Predictions Options window adjusts the weights of individual numbers when the patterns are being compared. When the slider is moved fully to the right then the pattern matching is strict and each number has the same weight.
Moving slider to the left relaxes the pattern matching as the numbers of the patterns being matched have lower weight when comparing them together. If the latest pattern is for example 6,11,11,23,15,6,18,13,13,29 then strict pattern matching may find for example pattern 9,20,13,21,12,8,15,15,4,27. With relaxed matching the best found pattern will be for example 33,16,25,14,31,11,18,12,16,30. As you can see the first few numbers of the best matching pattern match the latest pattern very loosely only. In both cases the predicted value is 10 however with relaxed pattern matching there were 9 valid back-test predictions while the strict matching produced only 7 valid predictions when back-testing on 15 latest draws. Relaxed pattern matching is recommend only when using larger pattern sizes (10 and more).
Predictions are available either from menu Winning Numbers – Predictions or from menu History – Predictions. Both menu commands start Predictions wizard.
You can track the progress of the prediction process at the lower right corner of the main window. When the process is finished the prediction results are available in Winning Numbers Properties and Winning Numbers Charts windows or in Summary History window under Sums and Charts tabs.
![]() – blue triangle indicates that the predicted trend is increase. That means the next value is expected to be greater than the latest value. The actual predicted value is also available.
– blue triangle indicates that the predicted trend is increase. That means the next value is expected to be greater than the latest value. The actual predicted value is also available.
![]() – red triangle indicates that the predicted trend is decrease. That means the next value is expected to be lower than the latest value.
– red triangle indicates that the predicted trend is decrease. That means the next value is expected to be lower than the latest value.
![]() – when both red and blue triangles are present in table cell then the predicted trend is level. That means the next value is expected to be the same as the latest value.
– when both red and blue triangles are present in table cell then the predicted trend is level. That means the next value is expected to be the same as the latest value.
Note: The predictions algorithm operates just with a sequence of numbers. In some cases the predicted value can be lower or higher than the minimum or maximum possible values. In such cases you should consider the predicted trend only.
Value n/a in prediction results means it was not possible to make valid prediction. Usually because there are not enough data to select the matching pattern.
![]() The predicted trend should be the main indicator when estimating values for the coming draw. The actual predicted value should be only a hint showing how big the predicted increase or decrease is.
The predicted trend should be the main indicator when estimating values for the coming draw. The actual predicted value should be only a hint showing how big the predicted increase or decrease is.
Hover mouse cursor over predicted cell to see a tooltip with additional information regarding the prediction. You can see how many back-test predictions were correct and the pattern size that has been used for predictions.
![]() It is recommended to ignore predictions with low percentage of successful back-test by entering required percentage of successful back-test into the last input field.
It is recommended to ignore predictions with low percentage of successful back-test by entering required percentage of successful back-test into the last input field.
Detailed information about the prediction process is available in Application Log. When the predictions are finished click menu View – Application Log. The Output window then shows the following details for each predicted value. For example:
Position 2 – name of the predicted value. In this case it is the winning number at the second ticket position.
Trend prediction: Decrease – predicted trend (increase/decrease/level)
Predicted value: 10.0 – the actual predicted value. Please note that all values are zero-based so the predicted winning number is 11.
Best pattern size: 5 – the pattern size used for the prediction.
Best weight: 1.0 – the weight used for pattern matching. The weight is always 1.0 unless relaxed pattern matching has been used.
Matching pattern: [10.0 17.0 11.0 15.0 29.0] => 10.0 – the best matching pattern found. In the case the best pattern are numbers 11,18,12,16,30. The number following this pattern is 11.
Marker: 94 – the position in the sequence of numbers where the best matching pattern has been found. Value 0 means the oldest draw.
Back-tests: 15 – the count of back tests that have been carried out to validate the pattern size.
Mean Square Error: 107.66666666666667 – shows how much the back-test prediction values differ from the actual values. The lower MSE the more accurate the back-test prediction values are.
Mean Absolute Percentage Error: 0.6399601052542229 - MAPE indicator also compares the back-test predictions with the actual values.
Valid trend predictions: 6 (40.0%) - how any back tests produced correct trend prediction.
See also Trend Predictions filter.